
Solve the following defective rate problem using the concepts learned about the geometric distribution.
A machine that produces a special type of transistor (a component of computers) has a 2% defective rate. The production is considered a random process where each transistor is independent of the others.
(1) What is the probability that the 10th transistor produced is the first with a defect?
(2) What is the probability that the machine produces no defective transistors in a batch of 100?
(3) On average, how many transistors would you expect to be produced until the first with a defect? What is the standard deviation?
(4) Another machine that also produces transistors has a 5% defective rate where each transistor is produced independent of the others. On average how many transistors would you expect to be produced with this machine before the first with a defect? What is the standard deviation?
(5) Based on your answers to parts (c) and (d), how does increasing the probability of an event affect the mean and standard deviation of the wait time until success?
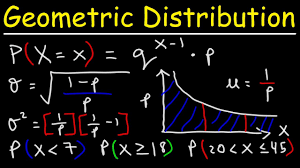
To solve the defective rate problem using the geometric distribution, we need to use the following formula:
P(X = k) = (1-p)^(k-1) * p
where P(X = k) is the probability that the kth transistor produced is the first with a defect, p is the probability of a defective transistor (given as 0.02 for the first machine and 0.05 for the second machine), and k is the number of transistors produced.
(1) To find the probability that the 10th transistor produced is the first with a defect, we substitute k = 10 into the formula:
P(X = 10) = (1-0.02)^(10-1) * 0.02
= 0.98^9 * 0.02
≈ 0.0167
So, the probability that the 10th transistor produced is the first with a defect is approximately 0.0167.
(2) To find the probability that the machine produces no defective transistors in a batch of 100, we substitute k = 100 into the formula:
P(X = 100) = (1-0.02)^(100-1) * 0.02
= 0.98^99 * 0.02
≈ 0.1326
So, the probability that the machine produces no defective transistors in a batch of 100 is approximately 0.1326.
(3) To find the average number of transistors expected to be produced until the first with a defect, we use the formula for the mean of a geometric distribution:
E(X) = 1/p
For the first machine with a 2% defective rate, p = 0.02. Therefore:
E(X) = 1/0.02
= 50
So, on average, 50 transistors would be expected to be produced until the first with a defect.
To find the standard deviation, we use the formula:
σ(X) = √(1-p) / p^2
For the first machine, p = 0.02. Therefore:
σ(X) = √((1-0.02) / 0.02^2)
≈ √(0.98 / 0.0004)
≈ 49.5
So, the standard deviation is approximately 49.5.
(4) For the second machine with a 5% defective rate, p = 0.05. Therefore:
E(X) = 1/0.05
= 20
So, on average, 20 transistors would be expected to be produced until the first with a defect.
To find the standard deviation, we use the same formula as before:
σ(X) = √((1-0.05) / 0.05^2)
≈ √(0.95 / 0.0025)
≈ 19.5
So, the standard deviation is approximately 19.5.
(5) Increasing the probability of an event affects the mean and standard deviation of the wait time until success. As the probability of an event increases, the mean decreases, indicating that we would expect to wait less time until success. On the other hand, as the probability of an event increases, the standard deviation also decreases, suggesting that the wait time becomes more predictable and less variable.