
Please check the expression and answer the following questions.
With the help of zeros, asymptotes, domain, and range, try to plot the function without the Desmos graph-making tool, then plot the same with the Desmos graphing tool, and check if your plot is the same as the Desmos’s plot or not. If your graph was not the same as the Desmos graphing tool, write which point from your textbook (Abramson, J., 2021, Section 5.6) you missed while plotting the graph without the Desmos graphing tool.
Also, check the value of the function at x=3. What do you think about no values of the function at x=3?
Answer:
Let’s start by discussing the zeros and asymptotes of the rational function f(x).
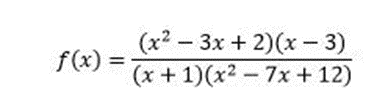
Zeros of a function are the values of x for which the function equals zero. To find the zeros of f(x), we set the numerator of the function equal to zero (Abramson, 2021). So, we have:
x² – 3x + 2 = 0
We can factorize this quadratic equation as follows:
(x – 2)(x – 1) = 0
From this, we can see that the zeros of f(x) are x = 2 and x = 1.
Asymptotes, on the other hand, are imaginary lines that the graph of a function approaches but never touches. In the case of rational functions, there are two types of asymptotes: vertical asymptotes and horizontal asymptotes (Abramson, 2021).
Vertical asymptotes occur when the denominator of the rational function equals zero. In this case, we need to find the values of x that make the denominator of f(x) equal to zero. So, we have:
(x + 1)(x² – 7x + 12) = 0
By factoring the quadratic equation, we get:
(x + 1)(x – 3)(x – 4) = 0
From this, we can see that the vertical asymptotes of f(x) are x = -1, x = 3, and x = 4.
Horizontal asymptotes, on the other hand, describe the behavior of the function as x approaches positive or negative infinity. To find the horizontal asymptotes, we examine the degrees of the numerator and denominator of the function.
In this case, the degree of the numerator is 2 and the degree of the denominator is also 2. Since the degrees are the same, we look at the leading coefficients of the numerator and denominator. In this case, both leading coefficients are 1.
When the degrees and leading coefficients are the same, the horizontal asymptote can be found by dividing the leading coefficients. So, the horizontal asymptote of f(x) is y = 1/1, which simplifies to y = 1.
Now let’s discuss the domain and range of the rational function f(x).
The domain of a function refers to the set of all possible input values (x-values) for which the function is defined. In this case, the only restriction on the domain is that we cannot divide by zero. So, the domain of f(x) is all real numbers except for x = -1, x = 3, and x = 4 (the values that make the denominator zero).
The range of a function refers to the set of all possible output values (y-values) that the function can take. In this case, since the function is a rational function, the range is all real numbers except for the values that make the function undefined (i.e., the vertical asymptotes).
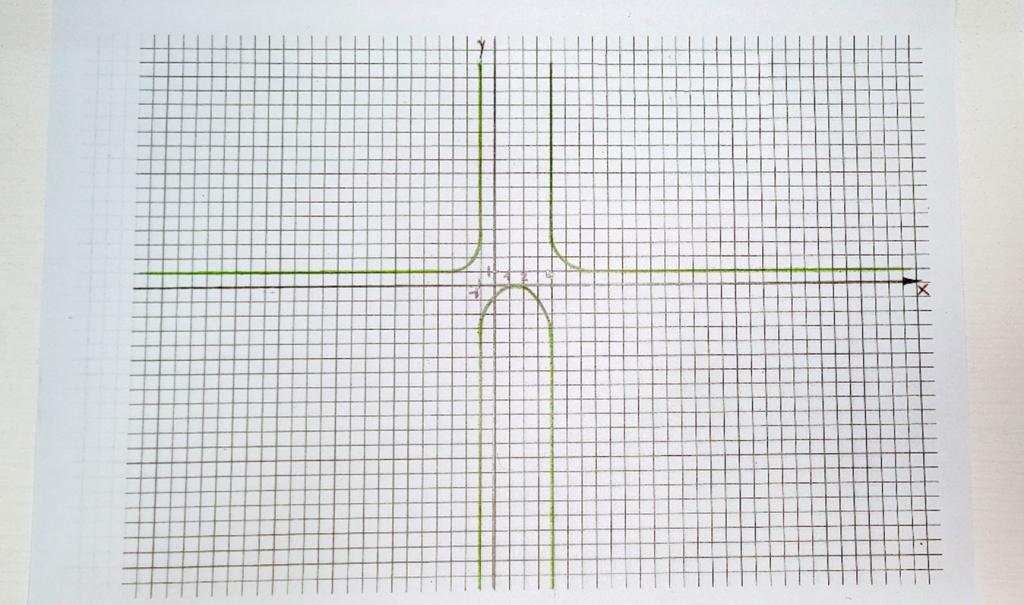
Now, regarding the plotting of the function, without the Desmos graphing tool, it would be challenging to provide an accurate graph without any specific values or intervals. However, we can make some general observations based on the zeros, asymptotes, domain, and range that we have discussed.
We know that the function has zeros at x = 1 and x = 2. This means that the graph of the function will intersect the x-axis at these points.
We also know that the function has vertical asymptotes at x = -1, x = 3, and x = 4. This means that the graph of the function will approach these vertical lines but will never touch them.
The horizontal asymptote of the function is y = 1. This means that as x approaches positive or negative infinity, the graph of the function will approach the line y = 1.
Based on this information, we can make a rough sketch of the function. First, we will need to draw the vertical asymptotes: vertical lines at x=01, x=3, and x=4. These lines represent vertical asymptotes. Then we need to draw a horizontal line at y=1, this line represents the horizontal asymptote. Finally, we need to draw the curve of the function and sketch a smooth curve that connects the points and follows the general shape of the graph.
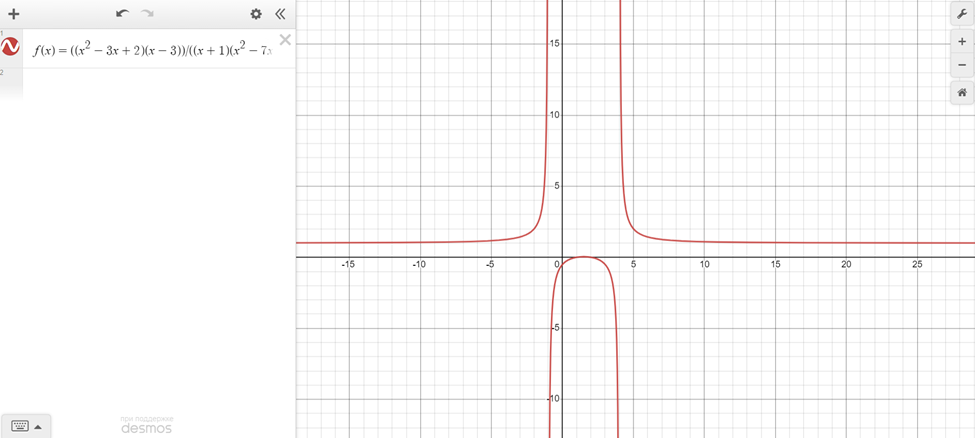
After finishing this sketch of the function, I plotted the same with the Desmos graphing tool and received more or less the same result:
Regarding the value of the function at x = 3, we need to evaluate the function f(x) at x = 3. Substituting x = 3 into the function, we have:
f(3) = ((3² – 3(3) + 2)(3 – 3))/((3 + 1)(3² – 7(3) + 12))
Simplifying this expression, we get:
f(3) = (2 * 0)/(4 * 0) = 0/0
The result is an indeterminate form, which means that the function is undefined at x = 3. This is because x = 3 is one of the values that make the denominator of the function equal to zero, resulting in division by zero.
In mathematics, division by zero is undefined because it leads to contradictions and inconsistencies. Therefore, we cannot assign a value to the function at x = 3.
References
Abramson, J. (2021). Algebra and trigonometry. OpenStax, TX: Rice University. Retrieved from https://openstax.org/details/books/algebra-and-trigonometry